Wondering how to create a requirements analysis for a project.
A requirements analysis is a much-needed early process software engineers use to meet a client’s budget, time, and quality expectations.
Gathering and analysing requirements are integral to defining and developing optimal software.
One of the primary benefits of requirements analysis is to reduce the risk of early problems in software development negatively impacting the budget and timeline.
A comprehensive analysis and gathering process could save your company time and money!
Let’s show you the process, the most common techniques, and how to maximise them.
What Is Requirement Analysis?
The requirements analysis process begins before a project progresses into the development stage. It helps an analyst or project manager discovering business goals to document and test them or create a visual representation. This process designs optimal software with the fewest risks possible.
Requirements Analysis Acceptance Criteria
The requirements analysis process ensures each requirement or final product conforms to the following:
- Testability
- Actionability
- Measurability
- Traceability
- Sufficiently detailed (document-worthy)
Advantages of a Requirements Analysis Process Before the Software Development Process Commences
Analysing requirements is instrumental to the success of any software engineering product. Here are some advantages of a requirement analysis:
- Faster delivery with highly detailed requirements that fit company needs
- A lower chance of defective or glitchy software products and the necessity for software rework
- Improved communication among stakeholders and the development team
- A collaborative development process that prioritises genuine requirements
- Growth and opportunity through gap analysis and other techniques
- A better product with an enhanced customer or user experience
Effective Communication During Requirements Analysis
The importance of effective communication in requirements analysis emphasises how clear and concise language, active listening, and communication channels improve the project’s success. A communication plan is one of the first deliverables our digital strategy consultants promise.
Alternatively, book a demo with our Requiment consultants to start early communication. Otherwise, learn more about us at Pulsion to learn how we prioritise effective communication. Some benefits of communication in the analysis phase include:
- Improved teamwork with everyone on the same page
- Problem-solving takes the fast lane
- Reduce miscommunication and incorrect requirements
- Increase efficiency and performance from the developers
Software Requirements Analysis and Gathering Tools
Requirements gathering and analysis tools online are available to your company, including our creation called Requiment. The benefits of using Requiment to analyse requirements are that our network site provides demo videos and a guided process to help you through each step.
Try our requirements analysis software tool over at Requiment.com and get a free trial today!
What Is Requirement Gathering and Analysis in Software Engineering? The Process Explained
A detailed analysis is a particular process with five steps, with the analysis step having multiple stages. Any software project requires this process for proper project planning and the ultimate final product. Let’s show you how the analysis phase works through all of the five steps.
Step 1: Identify Key Stakeholders
Different stakeholders have a say in software projects, including business owners, investors, business analysts, sponsors, managers, employees, customers, suppliers, users, and beneficiaries. Identified business stakeholders is the first step to understanding the business requirement list.
Business analysts must detail sufficient requirements, meaning all stakeholder expectations must be considered. Managing software engineering and all the tasks involved means an analyst must consider everyone who has a stake in the final product.
The stakeholders will have the final say in what’s included in the project scope.
Step 2: Requirements Gathering
A process of analysis, called software development life cycle requirements gathering, helps to identify software requirements from user stories, use cases, and other techniques. Software engineers may use the following techniques to gather relevant requirements:
- Data flow program (DFP) – define the project scope without too much detail.
- Use cases – determine system behaviour and communicate from the end user’s perspective.
- User stories – focus on user needs, user expectations, and user goals.
First, a business analysis reveals business requirements and user requirements before identifying software requirements in SDLC requirements gathering. It starts with identified business needs in the requirements-gathering process. A business requirement aligns itself with business needs.
Furthermore, requirement-gathering in SDLC also occurs in the form of these popular techniques:
- Interviews with key stakeholders
- Requirements-gathering focus groups
- Facilitated requirements workshops
- Surveys or questionnaires
- Customer mind-mapping
- Document observations
- Studying natural language documents
Step 3: Categorise, Define, and Prioritise Requirements
Analysts must then categorise, define, and prioritise requirements. Here’s how each task works in the third step of the process called requirements gathering and analysis.
Stage 1: Categorise Requirements
Analysts will have an ocean of requirements, starting with business, user, and system or product requirements. Business requirements are the high-level types that align with company goals, while user specifications reveal what end users expect from the product.
Analysts categorise the higher-level requirements into system requirements, which include the following:
- Functional requirements – the system behavior and how it responds to user input.
- Non-functional requirements – the attributes or performance of the system.
- Technical requirements – Technical issues to be addressed to develop the system.
- Operational requirements – Backend operations to complete for system functioning.
- Transitional requirements – How to implement the new system smoothly.
Stage 2: Define Requirements
Stage two of step three is to define the requirements. Analysts define every requirement in great detail to ensure they align with the business requirements recorded in stage one.
Stage 3: Prioritise Requirements
The third stage of the analysis step in project management is to prioritise which requirements are critical to the success of the software and which are simply nice to have.
Step 4: Requirements Analysis
The software development life cycle (SDLC) requirement analysis process includes stages. Business analysis in software development is essential to distinguish relevant and irrelevant requirements, tasks, and use cases before any development occurs.
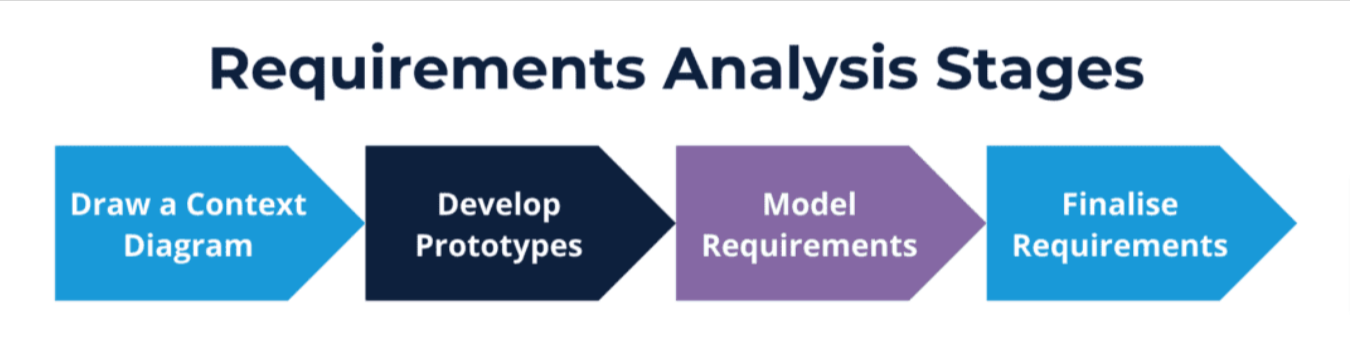
Analysts may use various requirements analysis techniques during the modelling stage. However, let’s see how the process works.
Stage 1: Draw a Context Diagram
Analysts often draw a context diagram that shows the interfaces and boundaries of the proposed system with the external world. It will also include external entities that may interact with the system, including actors, sinks, sources, and terminators.
The diagram will show the data flow between the entities and system to help company owners and the development team visualise business processes. It’s essential in business analysis to ensure the system’s context and prioritised requirements visually align with business needs.
Stage 2: Develop a Prototype (Optional)
Some analysts create prototypes of the systems a user requests to gather feedback from the relevant stakeholders through a beta phase. User stories often guide prototyping to ensure the testable product gathers feedback from the end-user’s perspective.
It helps the development team create a new or altered product with genuine user feedback. The prototype won’t have extensive features, but it will have enough data elements to test the idea and requirements before launching the final product.
Stage 3: Model Requirements
Visual representations are the key to a thorough requirements analysis. Analysts model the requirements with graphical representations of data elements, functions, entities, and the relationships between them. Modeling requirements also helps key stakeholders partake in the analysis process.
This stage uses data dictionaries, entity-relationship diagrams, data flow diagrams, and state-transition diagrams to identify inconsistent, incorrect, superfluous, or missing requirements. Only some requirements analysis techniques were shared above. Different analysts use varying techniques.
Stage 4: Finalise Requirements
The final stage of requirements analysis is when analysts study and correct data flow problems on the graphics, prototypes, and modules used to create user flow designs for analysis. Consistent and unambiguous requirements finalise for documentation, while inconsistent requirements are corrected.
Step 5: Requirements Documentation
A requirement analysis document finalises the first five steps, after which a project team awaits a sign-off before completing a software project.
A requirement analysis document (RAD) helps a business owner visualise the entire process and acts as a contract between developers and businesses.
It will include visual diagrams, user stories, use cases, and a complete system analysis. However, it should include the following:
- A purpose for the project
- An overview of the project’s audience
- Functional and technical requirements
Furthermore, the project team may have business process documentation to follow to ensure everyone completes the relevant tasks in the development process. However, the requirements analysis document has the following elements in different sections:
- Interpretations of user requirements
- High-level constituent parts are broken down
- A deep parts analysis, including diagrams and charts
- Identification of all the relevant details related to the requirements
- Identified existing and alternative technical solutions
- Details linking solutions to the problems
- The suggested best solution broken into fine details
- Methods to test the solution
Top Requirements Analysis Techniques
Software engineering uses requirements analysis tools before the software development process. The business process, stakeholder expectations, and functional requirements must be understood by all project managers and software developers.
The team effort ensures a higher chance of success. Let’s share some of the most common requirement analysis techniques used by project managers and include a requirement analysis example where applicable.
Many of these requirement analysis techniques are used during the modelling stage of analysis.
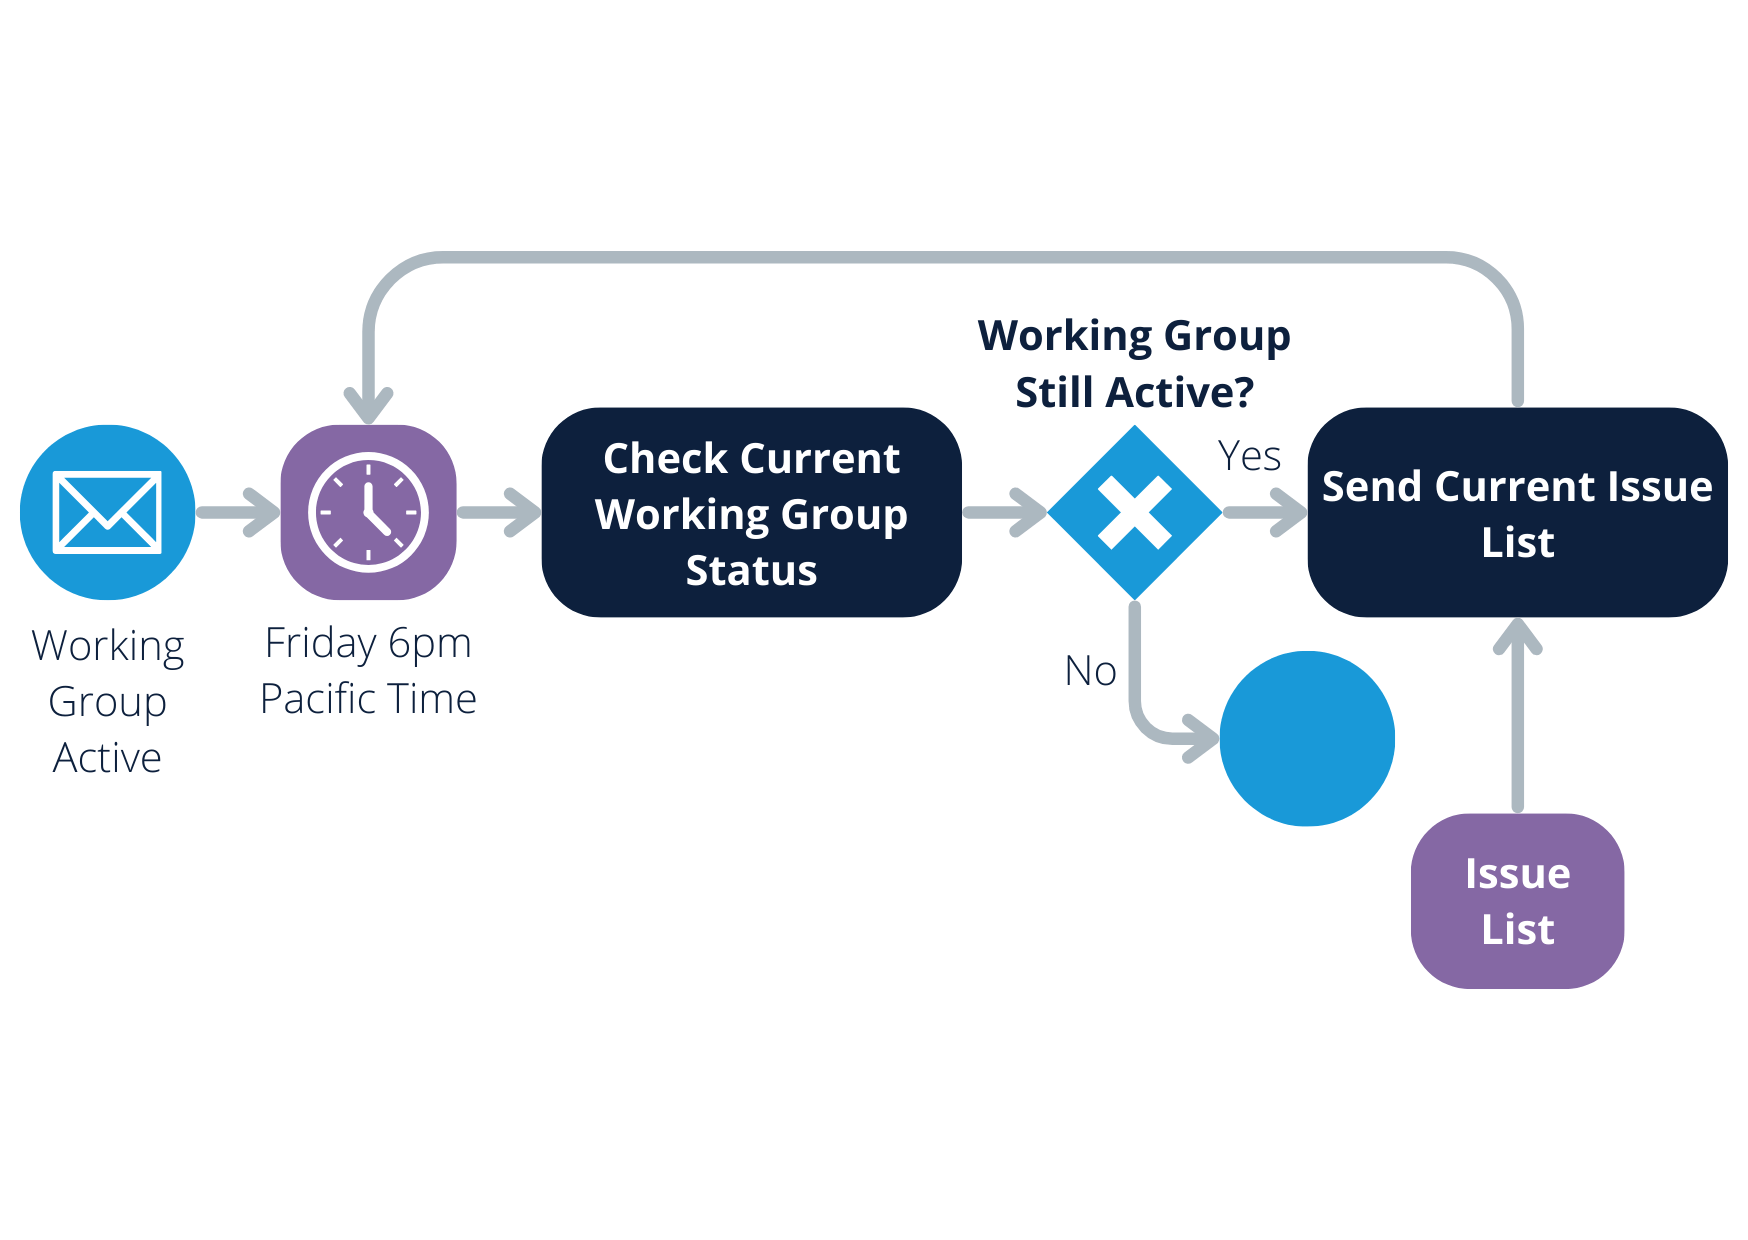
Business Process Model and Notation (BPMN)
The business process model and notation analysis (BPMN) method is used to create simple graphs to understand business processes. Analysts use it to coordinate message sequences between various participants in relevant activity sets. The sample below shows how the result looks:
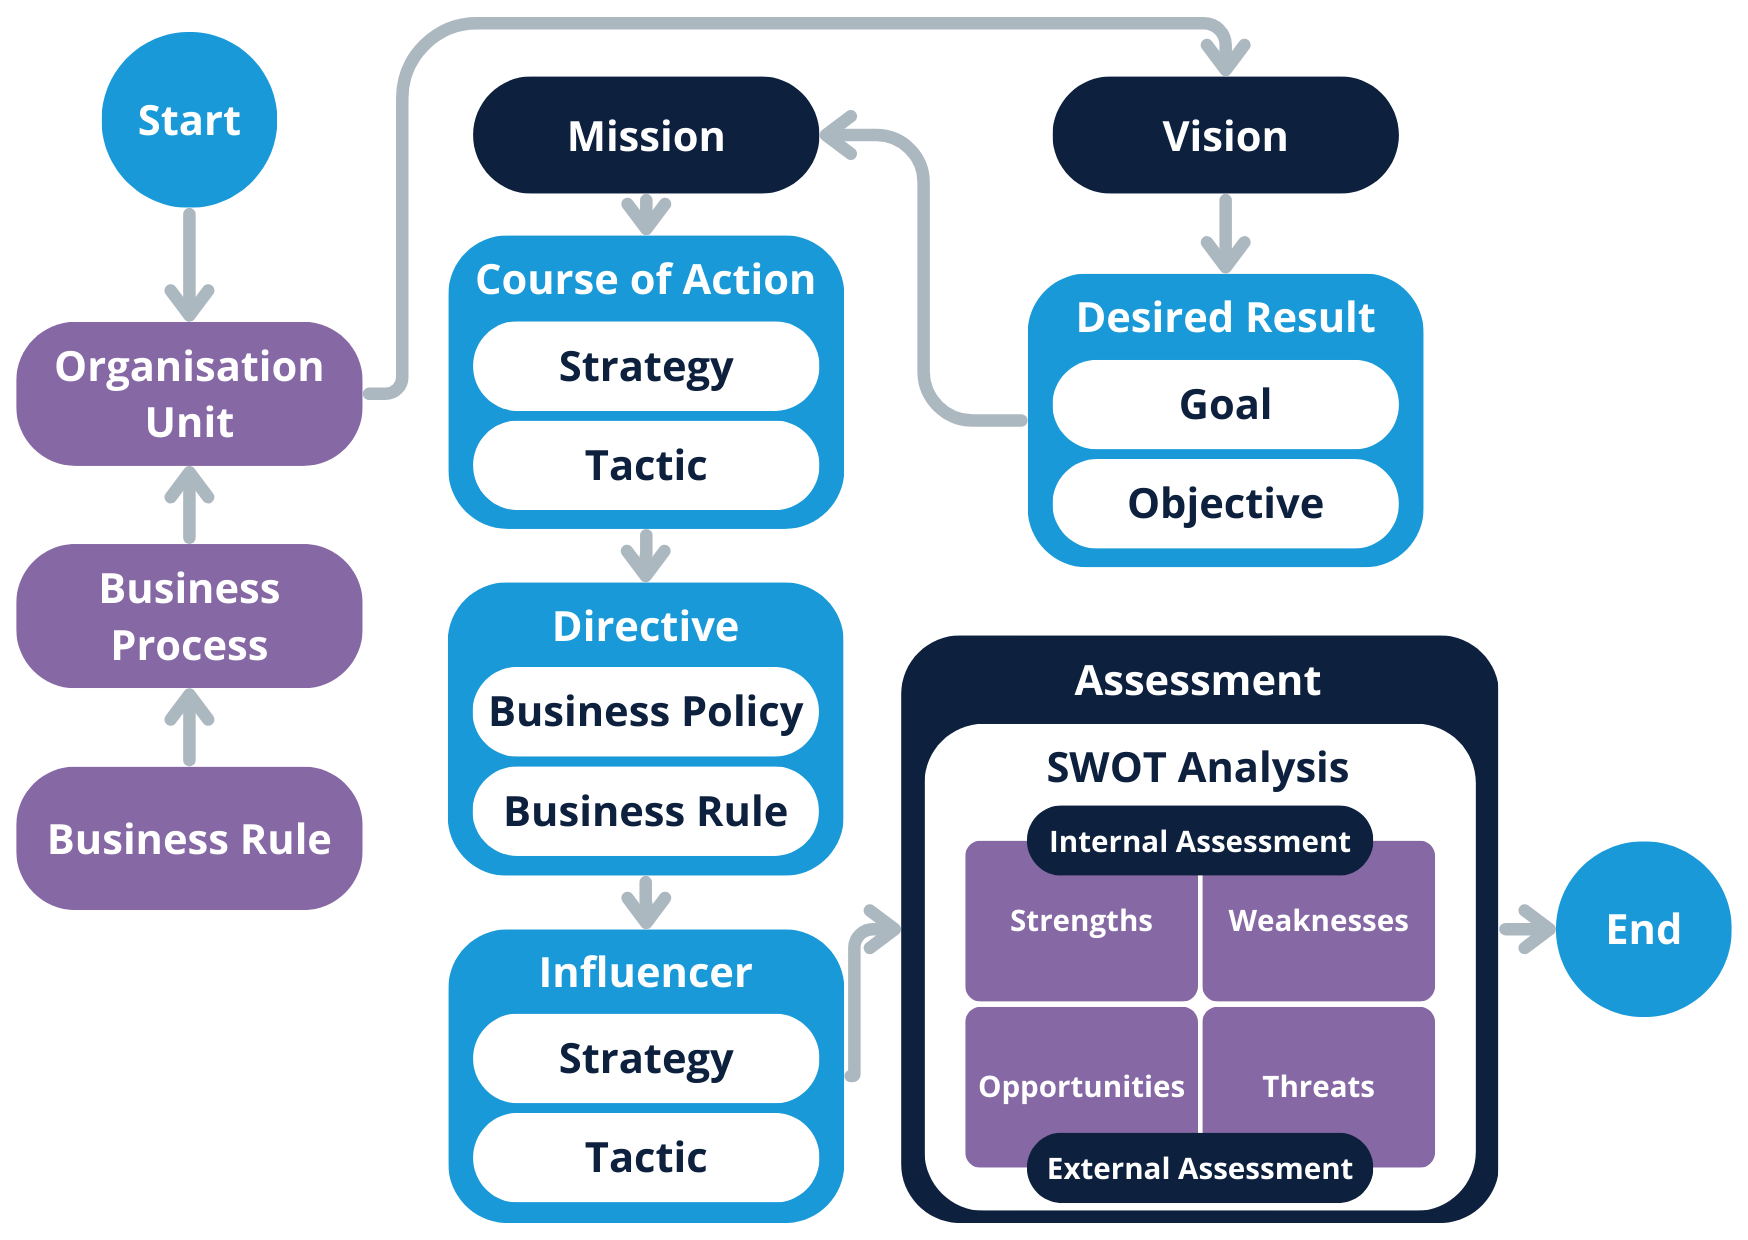
 Business Motivation Model
The business motivation model is used to help a company make decisions, but analysts also use it to make business-related decisions regarding requirements in the analysis stage. The technique essential for business governance works well as a requirements analysis technique.
The requirements analysis example below shows how the business rules influence multiple stages of analysis before project managers use a SWOT analysis. The SWOT analysis determines the internal strengths and weaknesses and the external opportunities and threats.
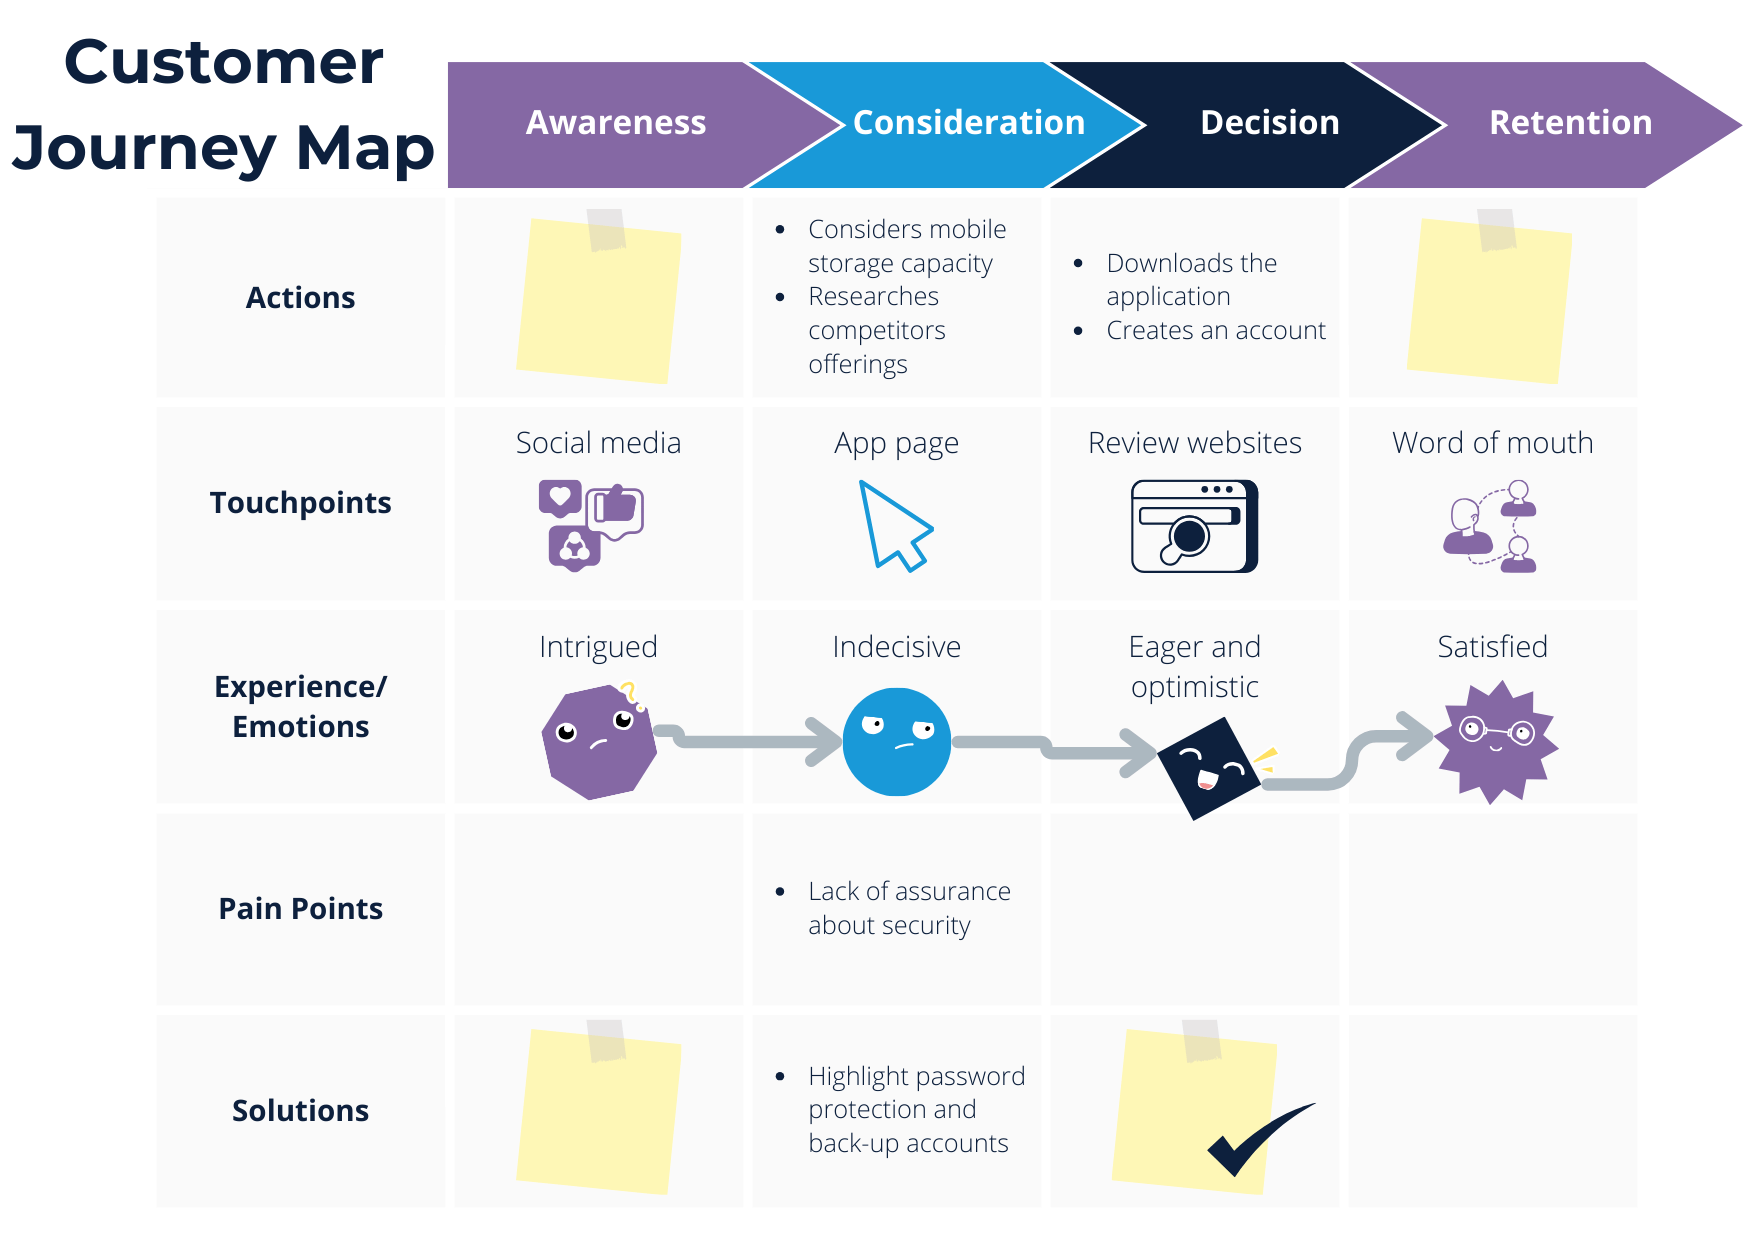
Customer Journey Mapping
A customer journey map is another brilliant visual representation used during requirement analysis. It displays customer fears, objections, and motivation to ensure the requirements will meet business and user needs. Additionally, a customer journey map could include other diagram information.
Analysts define persona and customer phases and describe touchpoints for the personas to interact with your software. You typically see a customer journey map like the one below, creating a visual journey of how your customer interacts with the software, including hints of motivation and pain points.
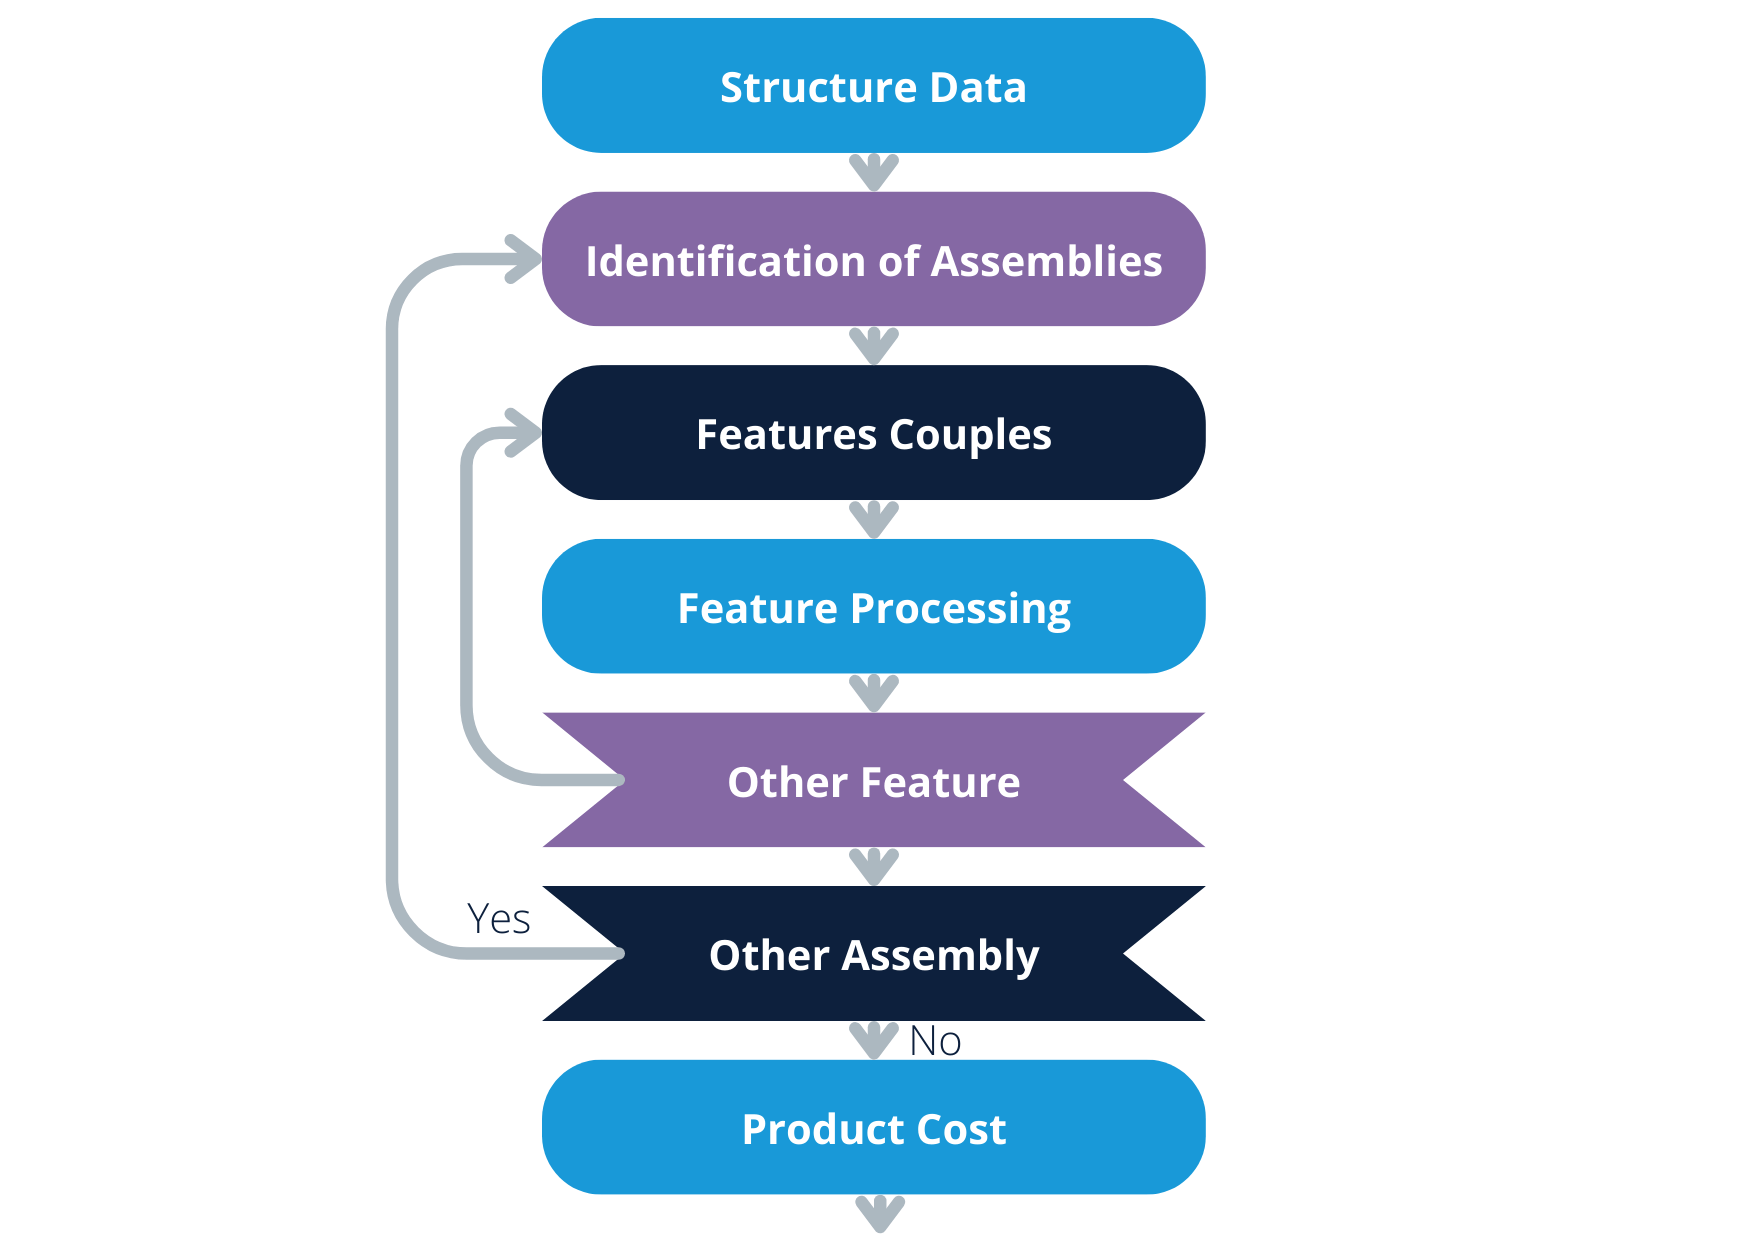
Flowchart Technique
The flowchart technique (data flow diagram) is another requirement analysis model used in the third stage of the process. It depicts the control logic and sequential flow of relevant activity sets. It’s a popular technique well understood by technical and non-technical team members.
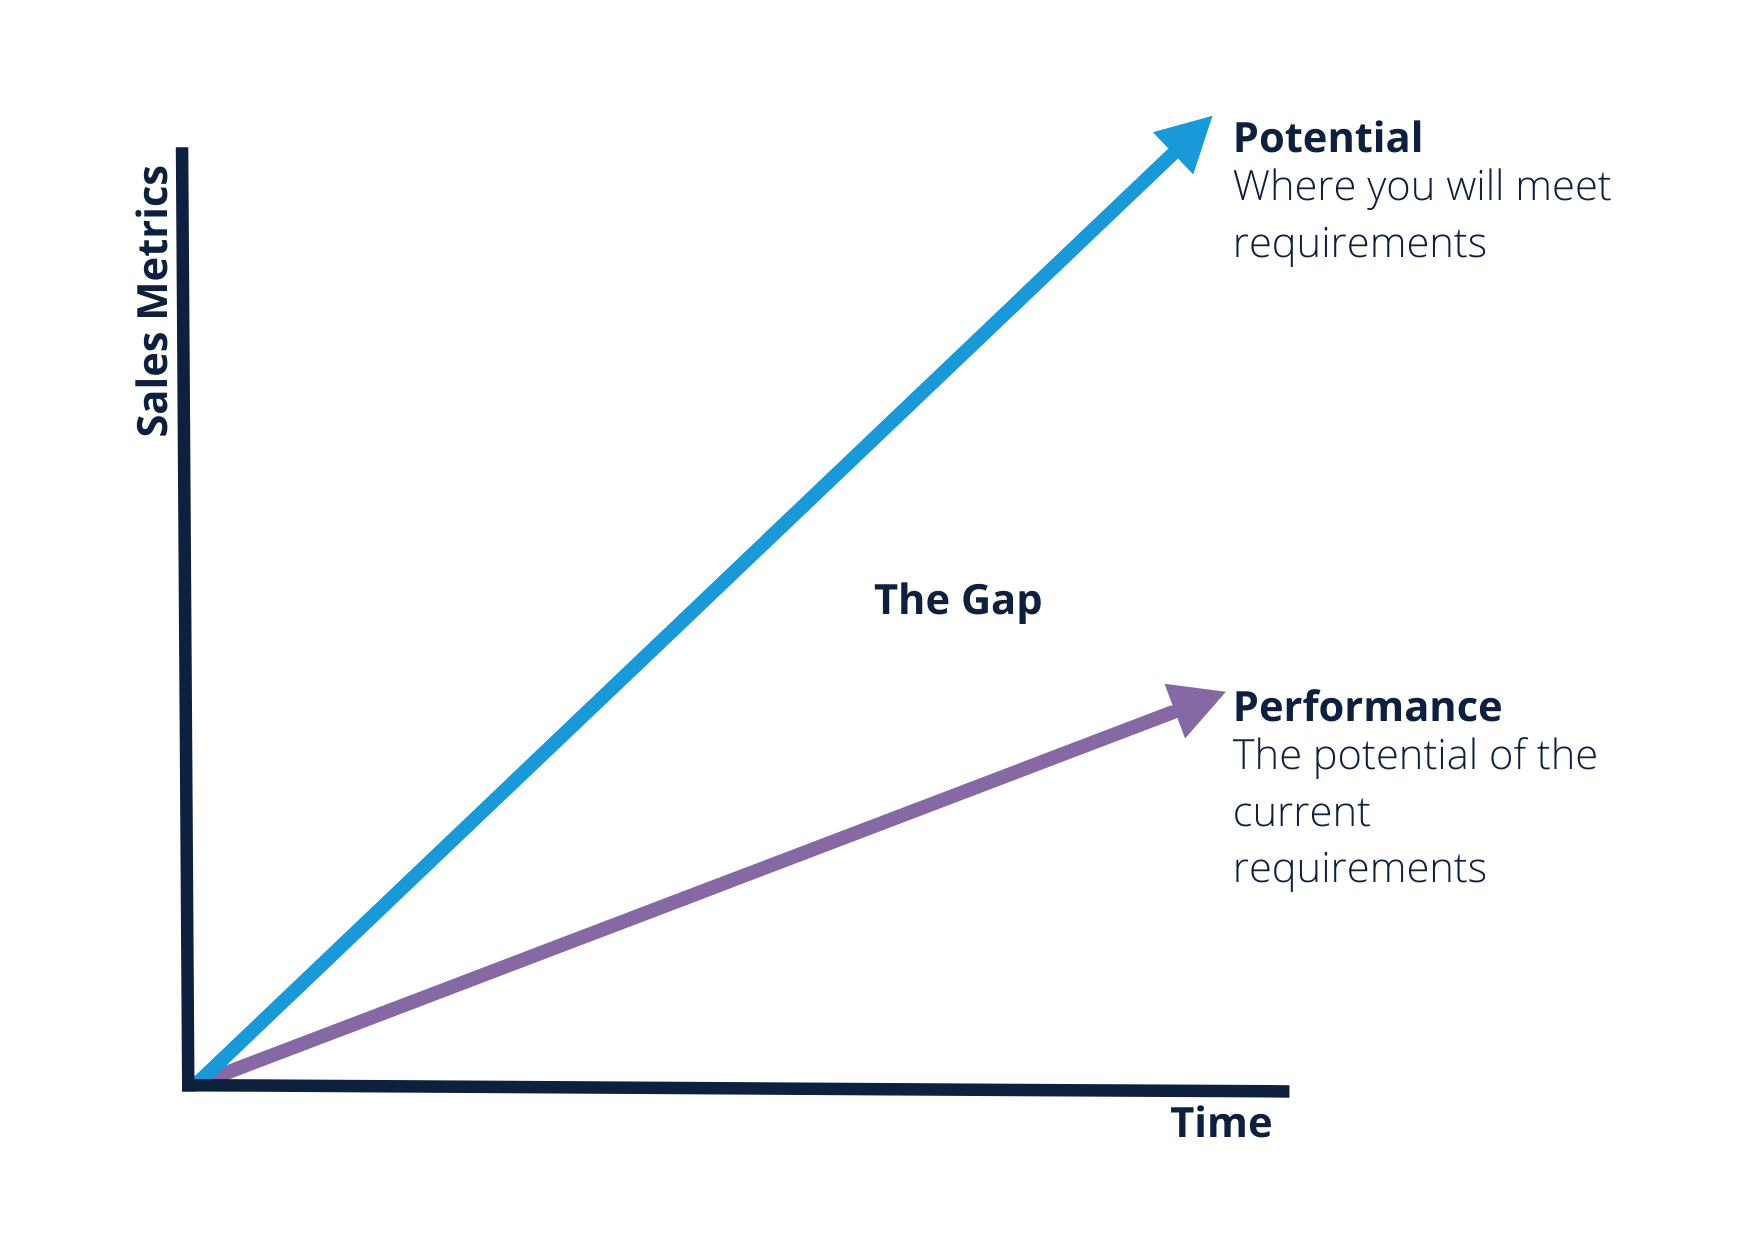
Gap Analysis
Gap analysis techniques allow project managers to distinguish the gap between where the requirements are and where they should be. Ultimately, it lets analysts determine whether requirements are met or not. A visual of a gap analysis chart may look much like the below sample with more details.
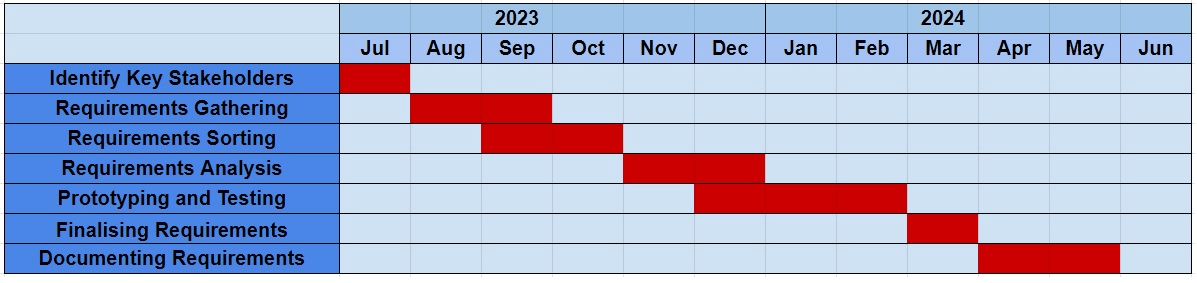
Gannt Charts
Gannt charts are an analysis technique used to plan and track scheduled task timelines. They help managers visualise the start and end dates of all the tasks related to a proposed software development process, including requirements analysis and gathering.
Unified Modelling Language (ULM)
Unified modeling language emerges as a powerful tool for requirements management, communication, and collaboration. It uses multiple diagrams and visual representations to help analysts make the best decisions about any requirement related to your intended software product.
The technique uses simpler diagrams to define a function the system will perform or a performance condition it must achieve. It’s a popular technique used to analyse functional and non-functional operational requirements. However, everyone understands the standard diagrams.

Summing Up the Requirements Analysis Process
The analysis process has four stages, but it’s an integral part of the initial five steps to complete the documentation.
The modeling phase has analysts using multiple resourceful techniques to determine which requirements truly meet your business requirements and needs.
Speak to an expert about managing the analysis process and techniques on your behalf. Don’t forget to sign up for a free Requiment trial today to use our online gathering and analysis tool.
Alternatively, speak to one of our digital strategy consultants or contact us to meet the team that will ensure smooth project planning and management.
Requirements Analysis Process Frequently Asked Questions
When Is a Requirements Analysis Used?
Requirements engineering is a process used to determine the precise expectations and needs of a new software product.
Frequent communication, stakeholder involvement, and conflict resolution are instrumental to successful requirements engineering to guarantee the best product possible.
Who Conducts a Requirements Analysis?
Requirement engineering involves an analyst, engineer, or project manager familiar with analysis tools, techniques, and preparation. These experts also need to know how to present diagrams, graphs, charts, and documentation that visually capture every element of optimal software.
Our digital strategy consultants can connect you to the ideal engineer, manager, or analyst to conduct your requirements analysis.
Alternatively, use the benefits of Requiment, an online tool created by us for businesses like yours.
What Are the 4 Stages of Requirements Analysis?
The four stages of requirement analysis include the following:
- Draw a context diagram – It shows the interface and boundaries with the external world.
- Create a prototype – An optional stage to collect early user feedback for improvements.
- Model requirements – Visual diagrams and charts to identify incorrect or missing requirements.
- Finalise requirements – Correct requirements are ready, and incorrect requirements are repaired before documentation.
How Do You Write a Requirements Analysis Document (RAD)?
A RAD document includes diagrams, sign-off features, and extensive requirements in visual representations.
However, the sections flow in a specific order to present the information well enough to let every team member jump right into the next stages of software engineering.
The RAD must have the following sections in the order noted:
- The Description – The project name, objectives, intended results, audience, and milestones.
- The Business Drivers – How the intended software drives revenue, cuts costs, and improves customer experience.
- Business Requirements – The high-level requirements and how they relate to business needs.
- Other Requirements – Highly detailed and prioritised requirements, charts, diagrams, and use cases.
- Key Contacts – A complete list of engineers, managers, and developers with detailed roles for the upcoming project.
- Document Sign-Off – The list of stakeholders needed to approve all the details in the previous sections.
- Document History – A history of changes to the document with version numbers.
How Do You Measure Software Requirements?
Learn more about requirements traceability in our article Requirements Traceability Matrix RTM Guide. Using an RTM allows project management teams to measure whether requirements meet organisation needs. It’s a comprehensive document that tracks and links user requirements with test cases.
What Is an Example of a Requirements Analysis?
Here’s a simple example of a fictional e-commerce requirements analysis section up to the functional specifications in a RAD document:
Project Name: ABC Online E-Commerce Website
Objective:
Create a user-friendly website for customers to browse and purchase online products from home.
Stakeholders:
- Shoppers or customers
- Website administrators
- Sellers and product vendors
- Payment gateway providers
- Shipping or logistics partners
- Website owners and sponsors
Functional Requirements:
User registration and authentication:
- Customers must log in and create accounts
- Have an option for social media log-in
- Authentication must be secure
Product Catalog:
- Display a product catalog categorised by brand and type
- Include good descriptions, high-quality images, and prices with products
- Allow customers to use keywords to search for products
Shopping cart:
- Enable customers to add or remove cart items
- Display total cart cost
- Save cart contents between sessions
Checkout and Payment:
- Provide a secure checkout process
- Offer multiple payment options
- Collect shipping or billing information
- Apply discounts and coupons where relevant
- Send an order confirmation email to customers
Order History:
- Store registered user’s order history
- Allow users to track and view orders
Product Reviews and Ratings:
- Allow registered users to rate products
- Display average ratings on product pages
User profiles:
- Customers can edit shipping addresses, contact details, and more
- Store multiple addresses for users
Inventory Management:
- Update product availability in real-time
- Notify admin when products are out of stock
Admin Panel:
- Provide an admin panel for managing orders and user accounts
- Use role-based access control for admin